How can applying data modeling to Building Automation System database make an operator’s job easier. Four common ways:
Histories – data modeling example “chartOn” tag
While equipment graphics tell the “now” story, historical trends can tell a more complete story. Easily available historical trends are what impressed me most about FIN|STACK. I was used to a legacy BAS where the data storage limitations prevented history on most points. I had to pick what I thought was the most important points. But of course problems would happen. An historical trend could have helped me diagnose a problem. I then had to disable the histories I had setup and enable history on the points I needed now. Then I had to wait for the problem to reoccur to fully understand what was going wrong.
Not with FIN|STACK! All points can have history enabled and are available from any graphic. You can also setup multiple history trends on one specific equipment or on any number of similar pieces of equipment.
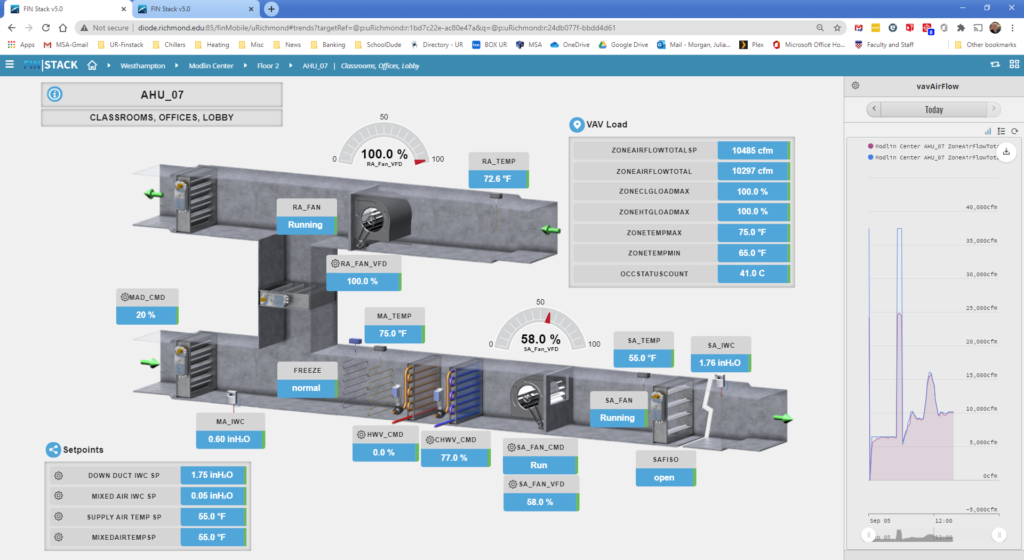
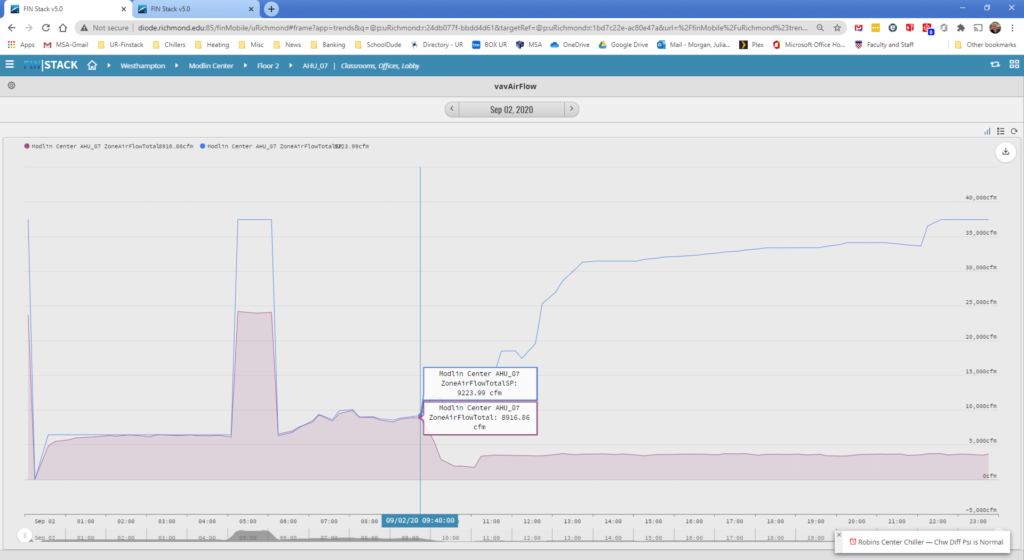
Here is an example of an air handler serving VAVs. The history chart compares the total air volume setpoint to the total actual air volume of the VAVs served by this specific air handler. The “chartOn” tag assigns this chart to every AHU with matching tags “equip and ahu and vavZone”

VAVs are assigned a ahuRef tag in the database which references the specific AHU supply air.
This chart shows 2 anomalies. The first at 5AM-7AM when the VAVs are commanded to maximum flow for outside air purge and the second at 9:40AM when a power blip caused the VFD to stop responding to the controlled output.
