How applying data modeling to Building Automation System can make an operator’s job easier. The 4 most common ways:
- User Interface
- Histories
- Program Logic
- Equipment Summaries
User Interface – data modeling example “graphicOn” tag
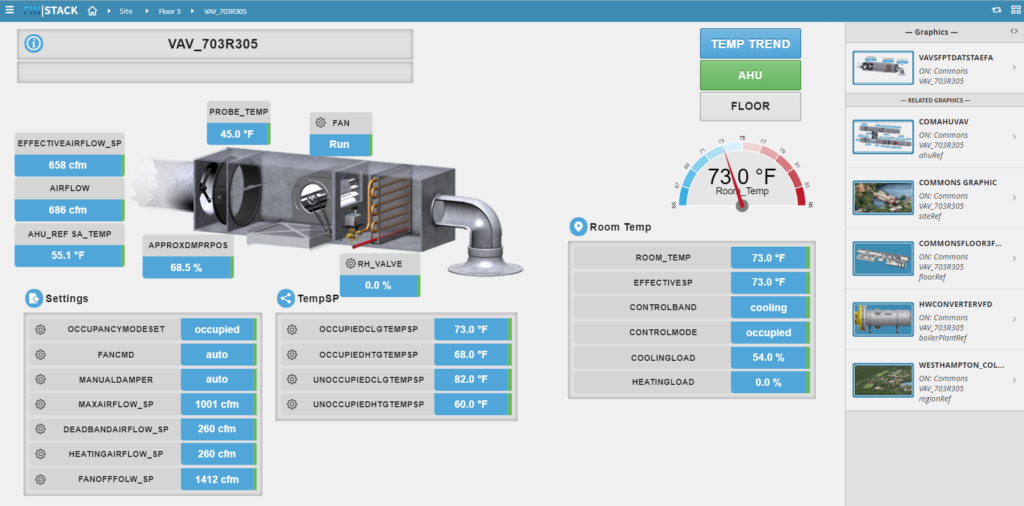
Graphics are the most used function for a BAS operator. At a glance they tell the story. If navigation is easy and intuitive, the operator spends more time analyzing equipment performance and less time navigating or searching for equipment point information. Utilizing data modeling, related equipment or building spaces are easily linked and displayed. An example of a VAV graphic –
Fin|Stack tagging automatically creates links to the site, floor, AHU serving the VAV, heating system providing hot water, and in this case a region the site is a part of. These links are automatically created by the data modeling and tagging associated with the VAV equipment. Additionally, in Fin|Stack links to individual point histories and schedules are built in to the graphic with “Magic Bubbles.”
The data modeling and tagging associates the equipment, in this case a VAV, with siteRef, floorRef, ahuRef, boilerPlantRef, and regionRef.
The fewer click between relevant equipment, the faster problems can be diagnosed, actions taken to resolve the issue, and program changes verified.
One VAV graphic with links to the different floors, AHUs, hot water systems, and regions all based on the tags of the VAV equipment. No extra programming is needed for the links to the site (siteRef), floor (floorRef), air handling unit, (ahuRef), heating system, (boilerPlantRef), and region of dite, (regionRef).
An AHU graphic would have links to the region, site, floor, hot water system, chilled water system, and others, automatically created by the AHU equipment tags.
